
6/20 Run the second version of simulation code, one of the output file "event_I_Q_1Mn.data_perAS.txt" is not generated.
6/21 Output "event_I_Q_S1_1Mn.data_queryLatency.txt" is generated with not decent format. Try to find out why the other output file is lost. Run run_1M needs near 20 hours.
6/22 The last empty line in event data input files ruins everything. This is the reason why output file "event_data_perAS.txt" is missing. Now the simulation runs.
6/27 Write eventGeneration file to generate event list including insert, update and query. In update event and query event, GUID are divided into three groups with different percentage events in whole events. The next step is to adjust simulation code to get latency data about all kinds of events.
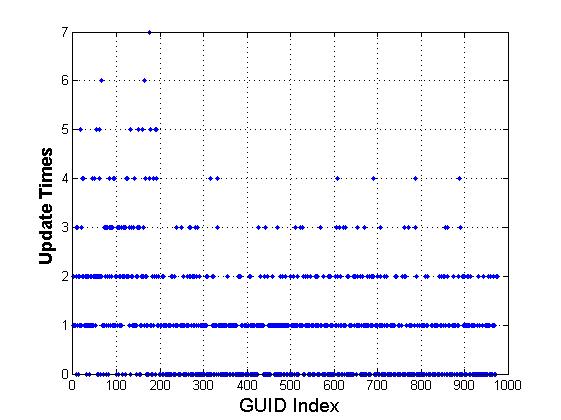
 In this event generation list, 1000 GUID generate 1000 updates.
Group 1 ( 20% GUID, from 1 to 200) generate 40% of the total update.
Group 2 ( 40% GUID, from 201 to 600) generate 30% of the total update.
Group 3 ( 40% GUID, from 601 to 1000) generate 30% of the total update.
Percentage can be adjusted according to mobility property.
In this event generation list, 1000 GUID generate 1000 updates.
Group 1 ( 20% GUID, from 1 to 200) generate 40% of the total update.
Group 2 ( 40% GUID, from 201 to 600) generate 30% of the total update.
Group 3 ( 40% GUID, from 601 to 1000) generate 30% of the total update.
Percentage can be adjusted according to mobility property.
7/14 query entry format: | src GUID | scr AS | dest GUID | timestamp |
The generation of dest GUID is based on popularity property.

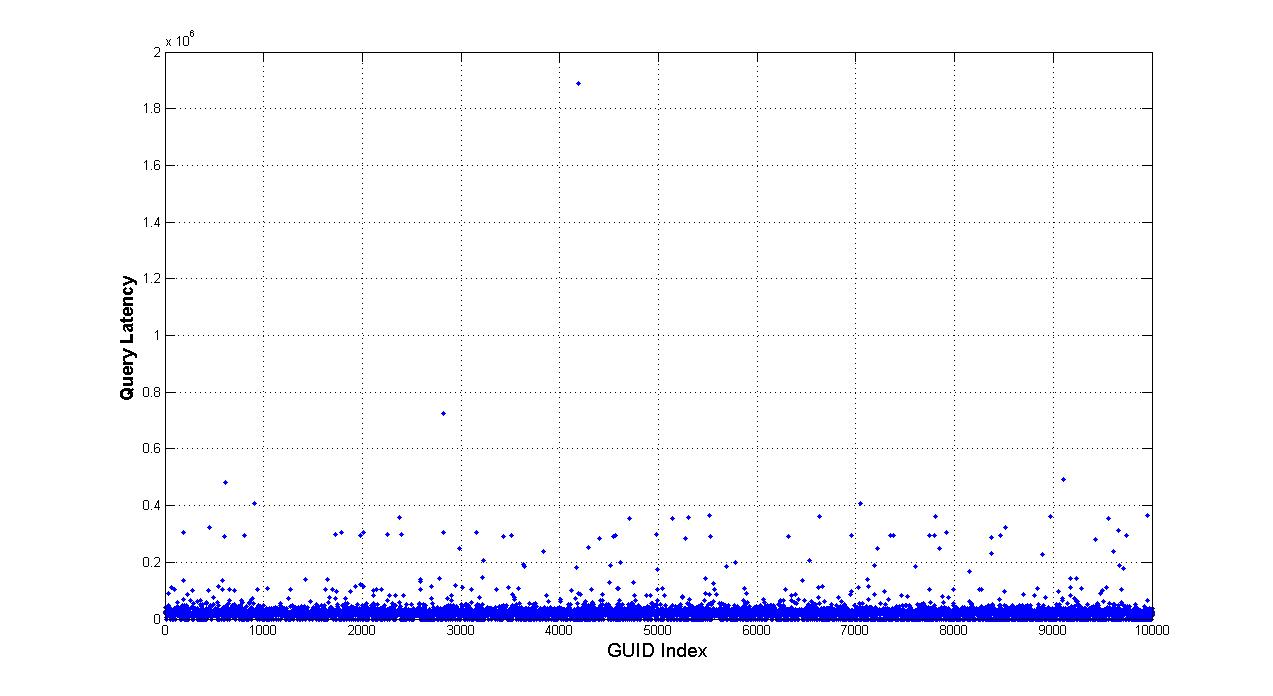
This is the original query latency analysis for 10K queries (total GUID number is 10K). At this time, query is generated randomly.
According to query type, queries can be divided into three groups: phone call query, Internet resource related query, others
- phone call query: strong related with location, most phone calls are to local people
- Internet resource related query: according to mobility characteristic, can be further divided into two groups: static GUID group and mobile GUID group
2.1 traffic between static and mobile group: popularity distribution is zipf like law
2.2 traffic within mobile group: similar to peer-to-peer network.
From paper "Analyzing Peer-To-Peer Traffic Across Large Networks", both the overall P2P traffic and the traffic from the top 10% heavy hitters are heavy tailed, not precisely zipf's distribution.
In paper "Peer-to-Peer Architecture Case Study: Gnutella Network", analysis shows that Gnutella node connectivity follows a multi-modal distribution, combining a power law and a quasi-constant distribution.
A useful database: http://crawdad.cs.dartmouth.edu/data.php
Statistical data conflict: From Cisco Visual Networking Index: Forecast and Methodology, 2010-2015, (1)in 2010, Global mobile data traffic will grow three times faster than fixed IP traffic from 2010 to 2015. Global mobile data traffic was 1 percent of total IP traffic in 2010, and will be 8 percent of total IP traffic in 2015. (2)Traffic from wireless devices will exceed traffic from wired devices by 2015. In 2015, wired devices will account for 46 percent of IP traffic, while Wi-Fi and mobile devices will account for 54 percent of IP traffic. In 2010, wired devices accounted for the majority of IP traffic at 63 percent.
Cisco Visual Networking Index: Forecast and Methodology, 2010-2015:
http://www.cisco.com/en/US/solutions/collateral/ns341/ns525/ns537/ns705/ns827/white_paper_c11-481360.pdf
7/27 After analyzing reports from cisco and morgan stanley, we build a model for the IP traffic of year 2010. The parameters in the model are approximate and might change as the Internet and communication pattern will change in the future.
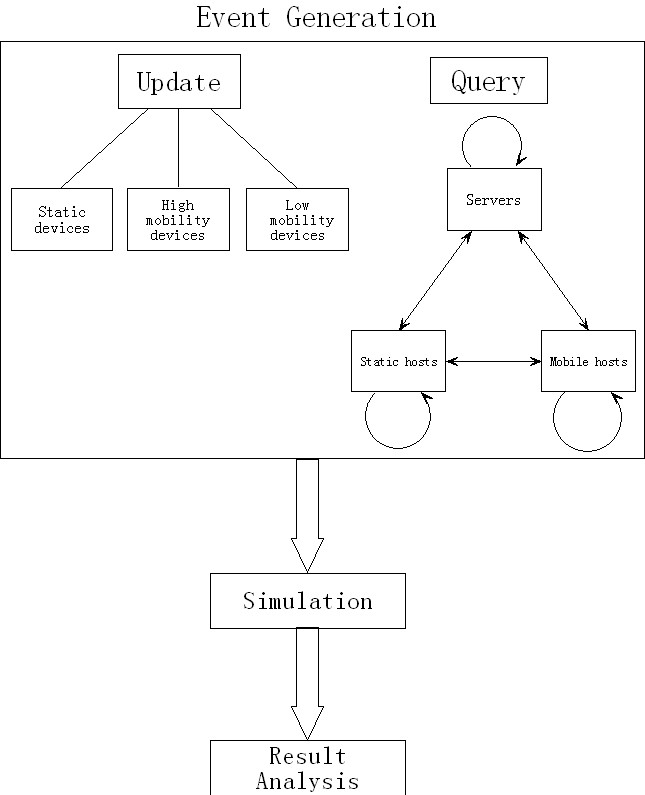
First version of design plan: Divide queries into three groups: servers(accounts for about 19.5% GUID), static hosts(accounts for about 38.5% GUID, such as desktops, laptops) and mobile hosts(accounts for about 42% GUID, such as smartphones, tablets) receive 71%, 28%, 1% queries respectively. Use modified zipf-Mandelbrot law with different parameters to describe popularity property for each group.

8/1 Generate 10 event lists for both 1K group and 10K group. In the query generation, use CDF method to sample the GUID. Input event lists into the simulation and get 10 sets of results. From the outputs, we can see that the average query latency is uniformly distributed. The number of query each GUID received is zipf like distributed with different degrees of heavy tail. This observation matches the event generation.
Next stage: first, solve the non-overlapping bug between update and query, and within update/query groups through the timeline.
Second, generate the event list for prototyping and validation in general format: |timestamp|event type|source GUID|source Network|destination GUID|destination Network|
Attachments (7)
-
Popularity estimation in a popularity-based hybrid peer-to-peer network.pdf
(353.0 KB
) - added by 13 years ago.
popularity estimation of peer to peer network
- Update_1K.fig (4.0 KB ) - added by 13 years ago.
- queryLatency_original_10K.fig (44.8 KB ) - added by 13 years ago.
-
Update_1K.jpg
(36.3 KB
) - added by 13 years ago.
Update_1K
-
queryLatency_original_10K.jpg
(93.0 KB
) - added by 13 years ago.
queryLatency_original_10K
-
query model.sdr
(13.8 KB
) - added by 13 years ago.
query model
-
query model.jpg
(51.0 KB
) - added by 13 years ago.
model
Download all attachments as: .zip